Data Analytics Projects
HR Data Dashboard
Tableau uses its own calculation language called Tableau Calculation Language (TCL) to create calculated fields and measures. It does not directly use Excel formulas.
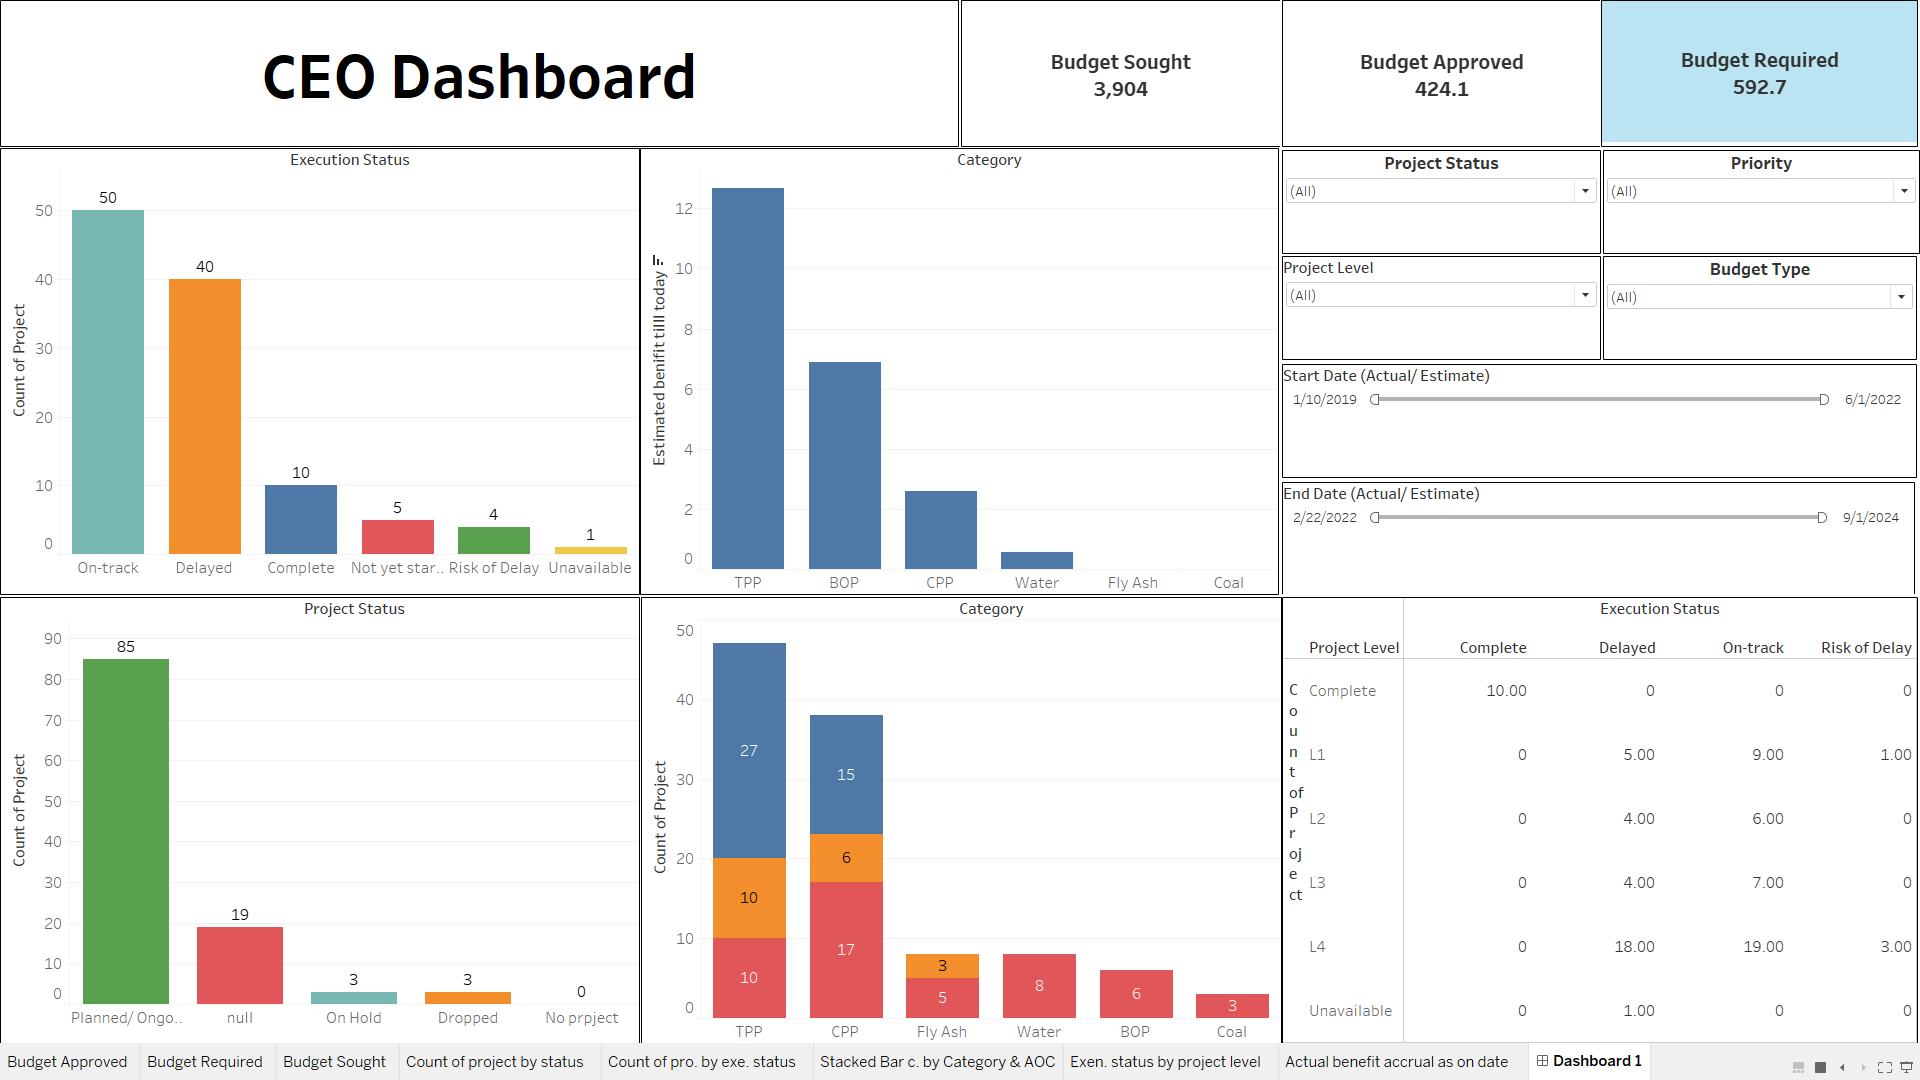
The dashboard, CEO dashboard it display KPIs (Key Performance Indicators) related to project execution and budget. Here’s a breakdown of the different sections of the dashboard and the kind of Tableau Calculation Language (TCL) expressions that could be used to create them:
Budget Sought vs. Approved vs. Required This section displays three measures created with TCL expressions: Budget Sought: This would likely sum the amount of budget requested across all projects.
Budget Approved: This would likely sum the amount of budget approved across all projects.
Budget Required: This could be another measure that calculates the current amount of budget needed to complete projects.
Execution Status This section uses a stacked bar chart to show the count of projects in different execution states (On Track, Delayed, Complete, Not Yet Started, Risk of Delay, Unavailable). A TCL calculation would be used to determine the execution status for each project and then a calculated field could be created to bin the projects into the different execution status categories. Finally, a measure would be created to count the number of projects in each category.
Project Status by Category This section uses a heat map to show the count of projects in different categories (Coal, Water, Fly Ash, etc.) across different project statuses (Complete, Delayed, On Track, Risk of Delay). Similar to the “Execution Status” section, TCL calculations would be used to determine the project status and category for each project, and then a calculated field could be created to assign each project to a cell in the heat map. Finally, a measure would be created to count the number of projects in each cell.
Budget by Project Level This section shows a table that breaks down the budget by project level (Departmental, Programmatic). A TCL calculation would likely be used to determine the project level for each project, and then a measure would be created to sum the budget amount for each project level.
Start and End Dates This section displays the earliest start date and the latest end date out of all the projects. Tableau has built-in functions to find minimum and maximum values. A TCL calculation could be used to determine the start and end date for each project, and then the MIN and MAX functions could be used to find the overall minimum start date and maximum end date.
The dashboard, CEO dashboard it display KPIs (Key Performance Indicators) related to project execution and budget. Here’s a breakdown of the different sections of the dashboard and the kind of Tableau Calculation Language (TCL) expressions that could be used to create them:
Budget Sought vs. Approved vs. Required This section displays three measures created with TCL expressions:
Execution Status This section uses a stacked bar chart to show the count of projects in different execution states (On Track, Delayed, Complete, Not Yet Started, Risk of Delay, Unavailable). A TCL calculation would be used to determine the execution status for each project and then a calculated field could be created to bin the projects into the different execution status categories. Finally, a measure would be created to count the number of projects in each category.
Project Status by Category This section uses a heat map to show the count of projects in different categories (Coal, Water, Fly Ash, etc.) across different project statuses (Complete, Delayed, On Track, Risk of Delay). Similar to the “Execution Status” section, TCL calculations would be used to determine the project status and category for each project, and then a calculated field could be created to assign each project to a cell in the heat map. Finally, a measure would be created to count the number of projects in each cell.
Budget by Project Level This section shows a table that breaks down the budget by project level (Departmental, Programmatic). A TCL calculation would likely be used to determine the project level for each project, and then a measure would be created to sum the budget amount for each project level.
Start and End Dates This section displays the earliest start date and the latest end date out of all the projects. Tableau has built-in functions to find minimum and maximum values. A TCL calculation could be used to determine the start and end date for each project, and then the MIN and MAX functions could be used to find the overall minimum start date and maximum end date.
 Dashboard View